Down the currency plughole
Posted by Richard on UTC 2023-05-01 14:11
Broken Britain? Even those mild-mannered citizens who prefer to look on the bright side – mustn't grumble! – have to admit that, wherever you look, only ruinous incompetence is to be seen these days. Transport, health, energy, public administration, housing, education, crime, policing, migration, drugs, anti-social behaviour… – each of these is its own slough of despond.
Wherever you look, all the once bright hopes have been extinguished. The biggie, the misbegotten National Health Service, is a lethal shambles with no hope of rescue; that other hope of the post-war government, the misbegotten Old Age Pension, has succeeded only in keeping those who depend on it in grinding poverty; the privatisations of the 1990s are now national embarrassments; more than half of the adult population are too skint to even qualify as taxpayers; the armed forces that emerged victorious from WWII and the Falklands conflict are now no longer fit for any other purpose than filling sandbags – the scraps of money they have been grudgingly allocated have been squandered in one procurement disaster after another.
This desolate state of affairs has not occurred over just a few years: Britain has been circling the drain at least since the end of the Second World War, arguably since the end of the First, in fact. Adam Smith's stoically optimistic observation that 'There is a great deal of ruin in a nation', made almost 250 years ago, is our motto in this respect. It is difficult though to imagine that there can be that much more left in Britain to ruin.
Can we measure this ruination? What about the exchange rate of the pound sterling, that is, its price in other currencies? Price is a measure of perceived value – desirability, if you like – so it reflects what the rest of the world thinks Britain is worth.
Here is a graph showing the exchange rate of the pound sterling (GBP) against the Swiss franc (CHF) from 1953 (Elisabeth's coronation) to the present day (Charles' coronation). In other words, the number of Swiss francs you got for one pound during the reign of Elizabeth II.
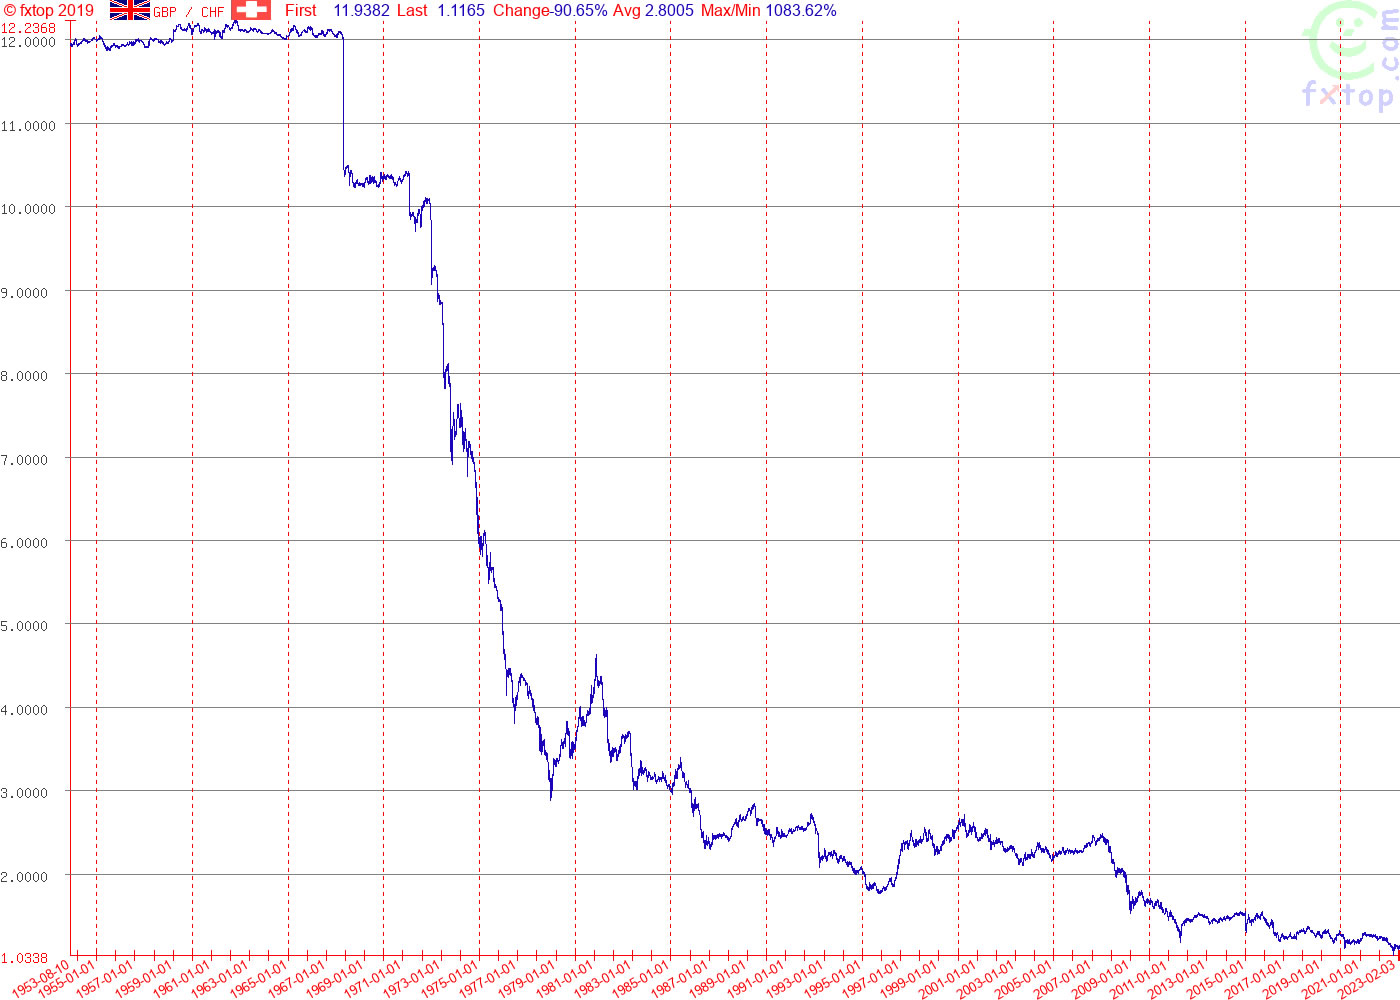
Graph of the exchange rate of the pound sterling (GBP) against the Swiss franc (CHF) 1953-2023. Click to open larger image in a new browser tab. Image source: fxtop.com
Why the Swiss franc? Because it has a well deserved reputation as a 'hard' currency. Down the years Switzerland has followed a path of fiscal conservatism, balanced budgets and stable and predictable policies. In fact, since the beginning of the 1980s the recurring difficulty for Switzerland has been to try to soften its currency in order to keep its exports affordable in the weaker currencies – particularly in the Deutschmark/euro zones (DEM/EUR), its most important trading partners.
Now it requires no degree in economics to see from this graph that the GBP is anything but a hard currency. It is, in fact, an extremely soft currency, which, apart from a dose of early Thatcherism and late Majorism (tracking the DEM, without the fiscal discipline to maintain the rate), has been circling the fiscal drain for most of this time.
Older readers will be hunting little bits of nostalgia in the graph: Wilson's notorious 'pound in your pocket' devaluation (it's the Gnomes of Zurich wot did it); the decade-long slump in the dreary, beige seventies into the 'Winter of Discontent' in 1979 (in the end a drop about four times larger than Wilson's devaluation); Nigel Lawson's fiscal mini-boom; Gordon's sleight of hand which kept the cart on the road for half a dozen years – until it didn't.
Ageing nostalgics will also remember very occasional and very fleeting glimpses of the large white five pound note, printed in fine copperplate on only one side. It was around the size of a modern A5 sheet and thus radiated immense worth. It appeared in 1945.
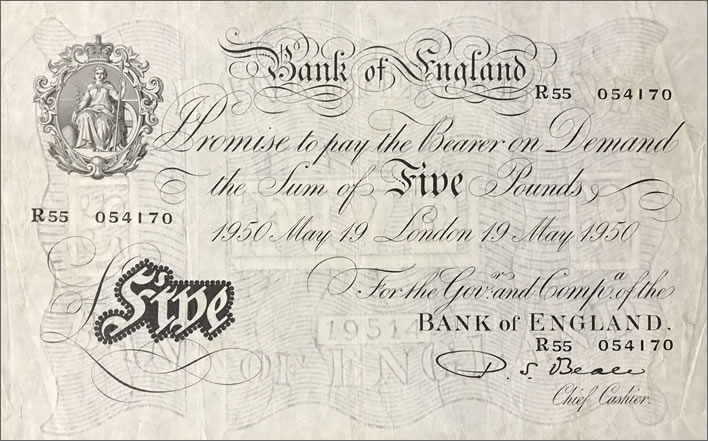
Unlike its predecessor, which appeared in 1793, it didn't last long: in an early sign of the worthlessness to come, it was withdrawn in 1957. Its demise occurred close to the start of our Elizabethan age. Now, at the end of that reign, we have a five pound note that is half the size and one tenth the value.
My own bit of nostalgia is that brief moment on that very rapid seventies slide downwards when I changed my handful of pounds into Swiss francs at around six francs to the pound. 'Hit the road, Jack', I thought. A good decision in almost every respect, except that now the GBP and the CHF are almost at parity and that's my UK pension screwed.
Just for fun, let's turn the graph around to show how many pounds one Swiss franc cost – from 8p in 1953 to 96p in 2023:
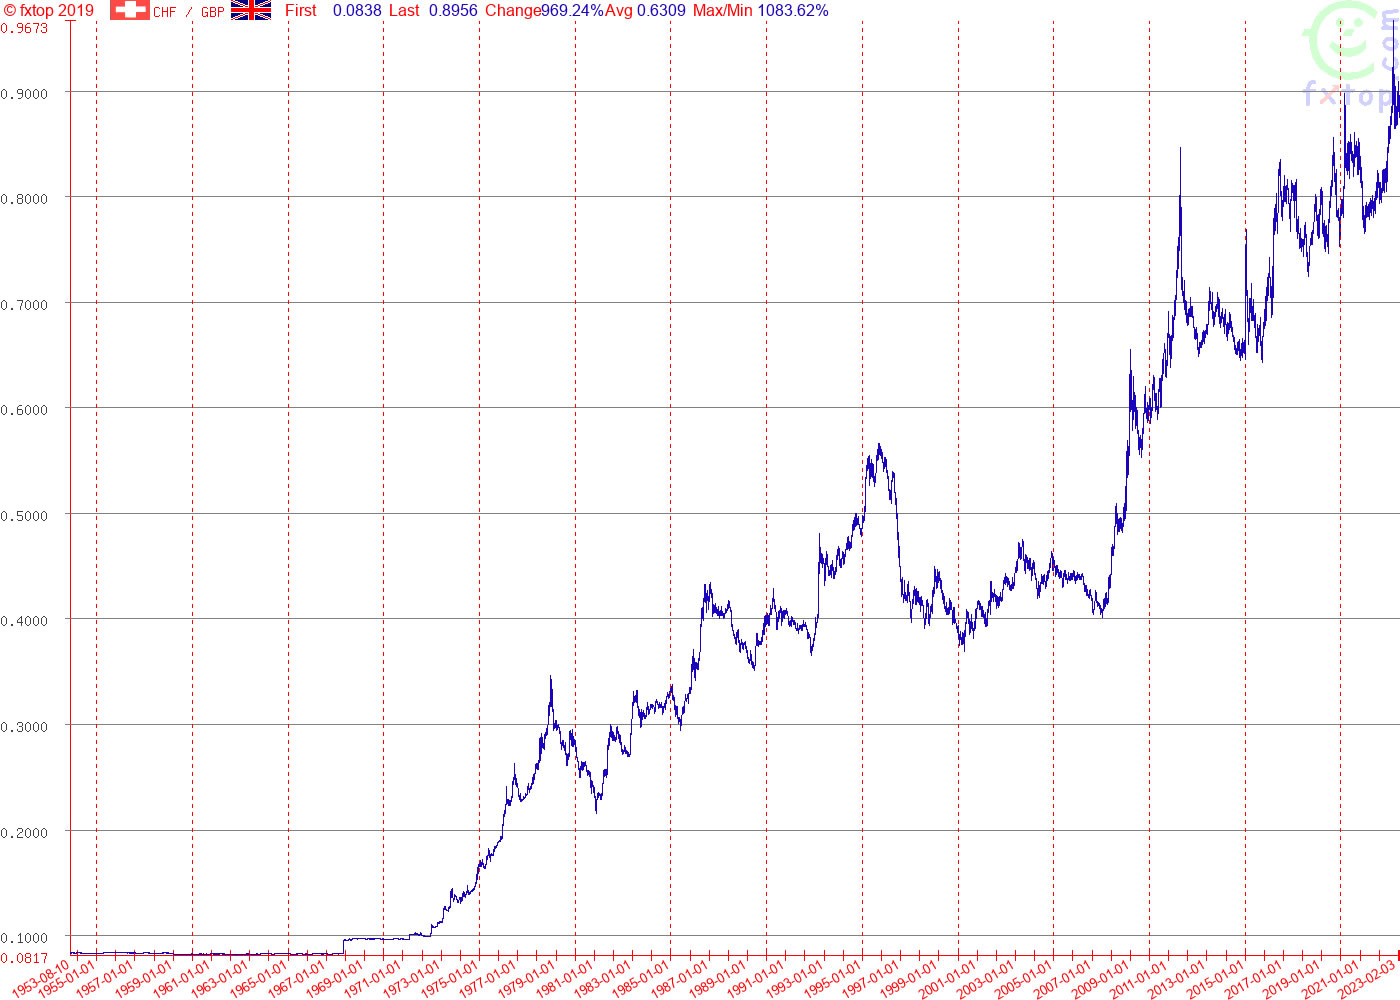
Graph of the exchange rate of the Swiss franc (CHF) against the pound sterling (GBP) 1953-2023. Click to open larger image in a new browser tab. Image source: fxtop.com
Establishment economists reading this are spitting out their dummies and throwing their tattered teddies at their monitor screens while shouting: 'It doesn't matter. It's meaningless. Ignore the exchange rate'.
No, it isn't meaningless, as readers will have realised during our nostalgic trip down memory lane. And yes, it does matter, for if there is one economic measure that really matters it is the exchange rate. Nations that don't care about their currency are circling the drain along with their worthless currencies, as demonstrated in that one graph. If you disagree, just name me a basket-case country with a strong currency.
We recall that it was the establishment economists who were assuring us simpletons that Quantitive Easing was certainly not 'printing money' – until, that is, it was and now we are all fretting about inflation.
Readers should note the number above the graph: 'Change -90.65%'. In other words, during the last seventy-odd years, the pound – a.k.a 'the pound in your pocket' – lost ninety percent of its value against the Swiss franc, having gone from around 12:1 to near parity.
For the avoidance of doubt, let's look at the pound and another relatively hard currency, the Deutschmark as was (DEM). How many DEMs did you get for your GBP?
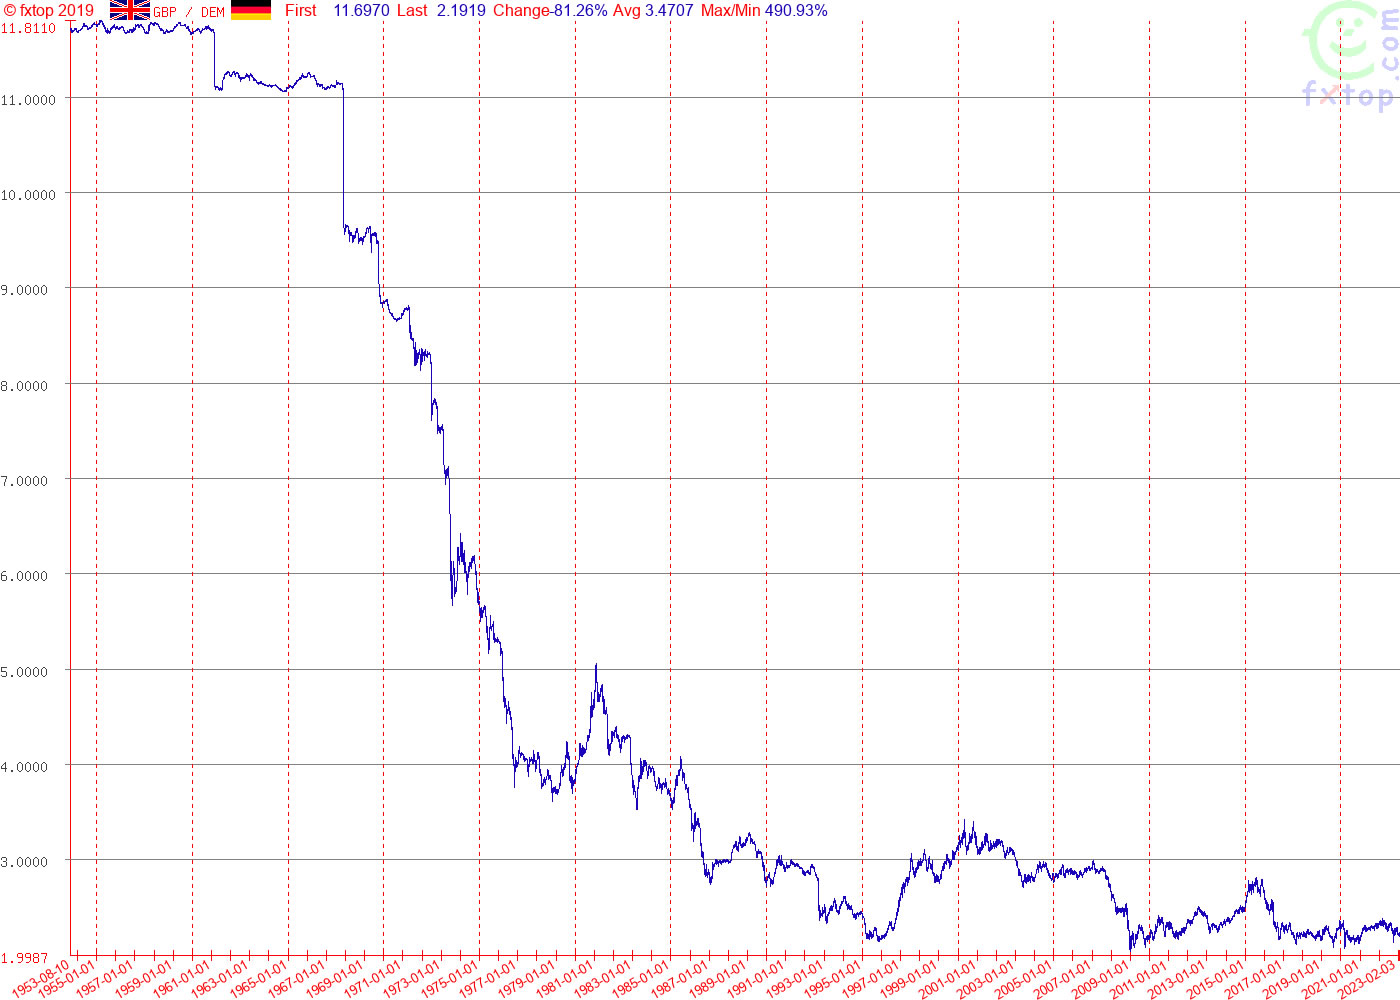
Graph of the exchange rate of the pound sterling (GBP) against the Deutschmark (DEM) 1953-2023. After 1 January 1999, the DEM was subsumed into the euro. From this point on, the graph shows the rates for the DEM's proportion to the euro (1.95583). Click to open larger image in a new browser tab. Image source: fxtop.com
We immediately note how broadly similar this graph is to the CHF graph. Note, though, that the y-axis on the DEM graph is numerically smaller than on the CHF graph: the change is 'merely' 81.26%. The Germans were very happy that mixing in the dross of other weakling currencies into the EUR effectively devalued the DEM and made it easier for German manufacturers to export their products.
It's a fine old British habit to try and look on the bright side even as you take one more turn around the plughole. Let's take some comfort at some other nations' even more defective currency management compared with the UK.
France, for example. Remember that this is a graph of the FRF against the GBP (not CHF) – that is, the number of French francs one British pound would buy you:
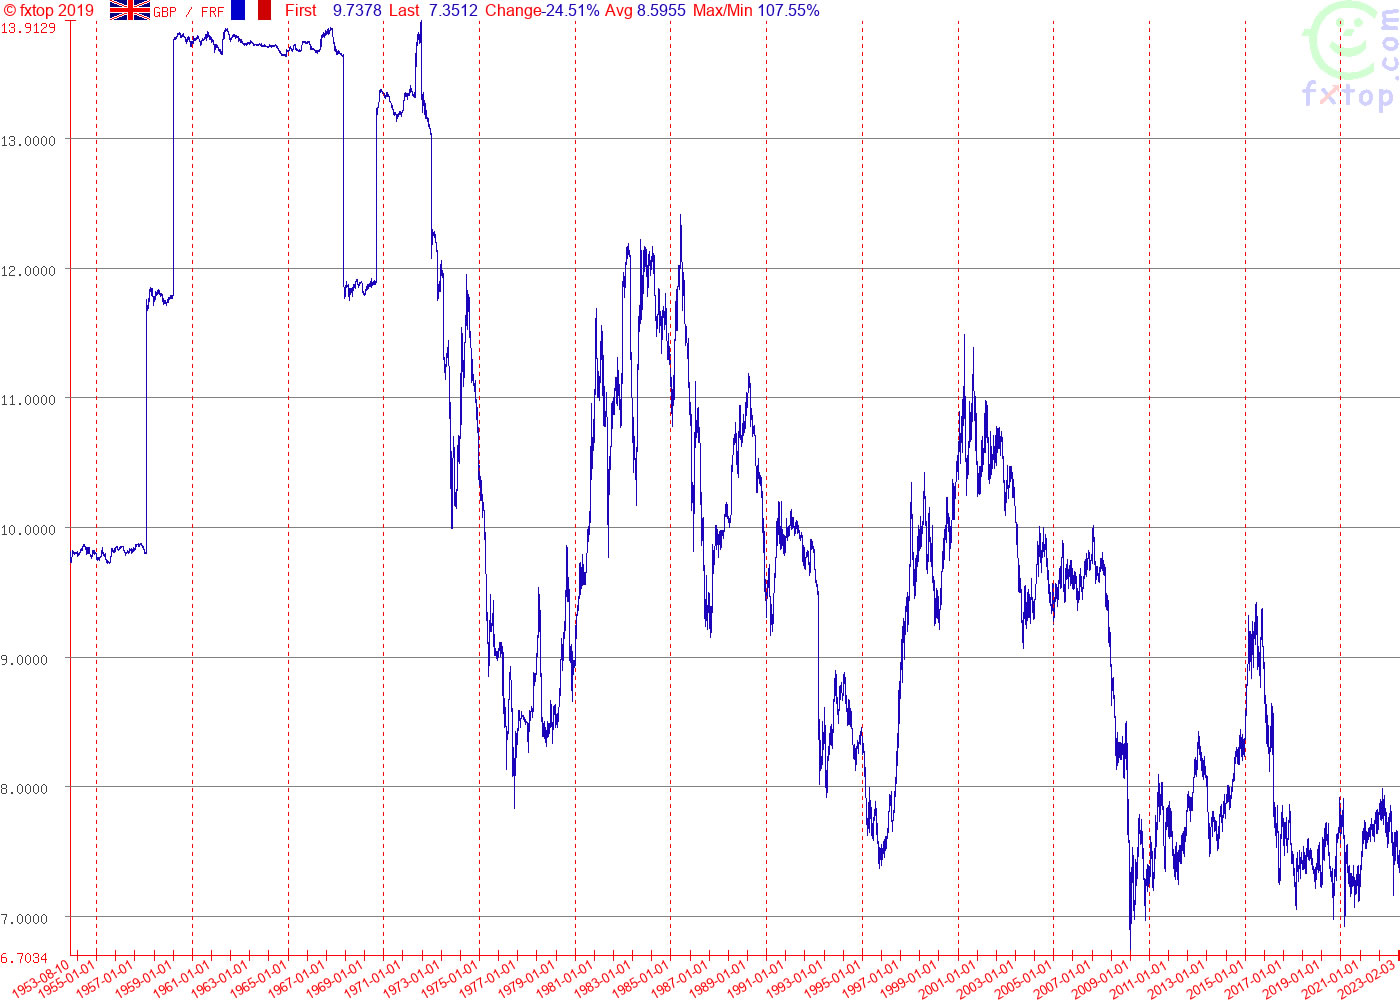
Graph of the exchange rate of the pound sterling (GBP) against the French franc (FRF) 1953-2023. Click to open larger image in a new browser tab. Image source: fxtop.com
The rapid rise at the beginning of the period was the changeover from the old French franc to the modern currency (FRF). If this graph is the best a nation can do compared to the GBP, then it's in trouble. This is what happens when you pimp your pension system and lash out on the 'grands projets'. The y-axis is quite short, which exaggerates the volatility of the euro after 1999.
Here's another basket case, Italy (ITL), plotted against the GBP. It shows the number of Italian lira one British pound would buy you:
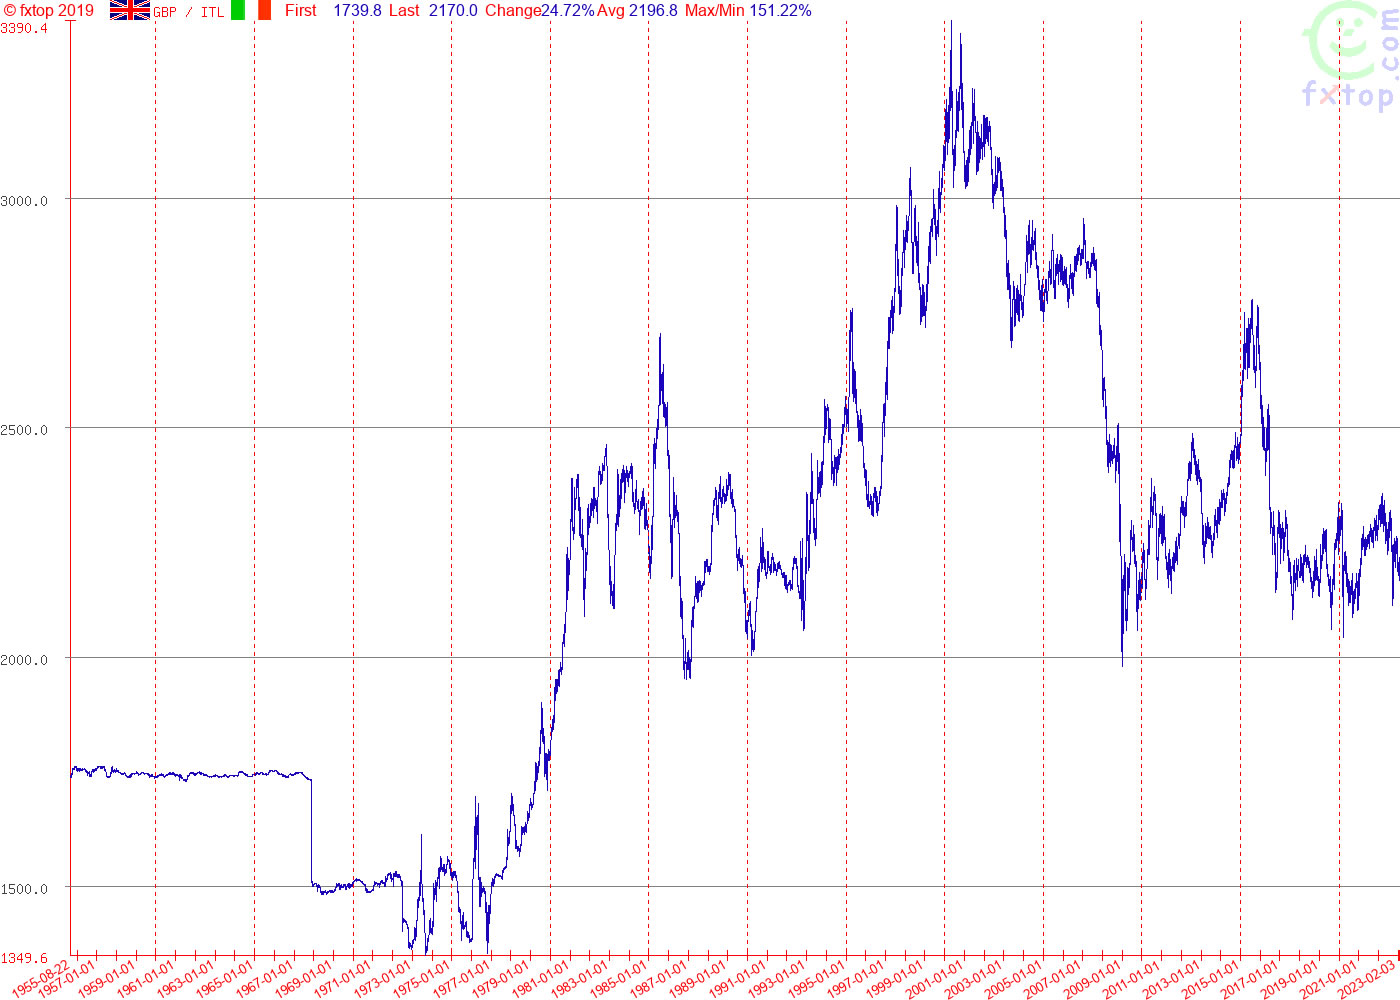
Graph of the exchange rate of the pound sterling (GBP) against the Italian lira (ITL) 1953-2023. Click to open larger image in a new browser tab. Image source: fxtop.com
Italy's decline even puts the GBP in a good light. I can recall a time in the 1990s when telephone tokens – grubby discs with a hole in the middle – became an accepted form of currency in Italy. Orthodox small coins were not worth the cost of minting them. Readers can see how Italy was fiscally rescued in 1999 by the euro, at the cost of later economic ruin at the hands of the Germans.
One last basket case to cheer Brits up, Spain (ESP) plotted against the GBP. How many Spanish pesetas would a pound buy you?
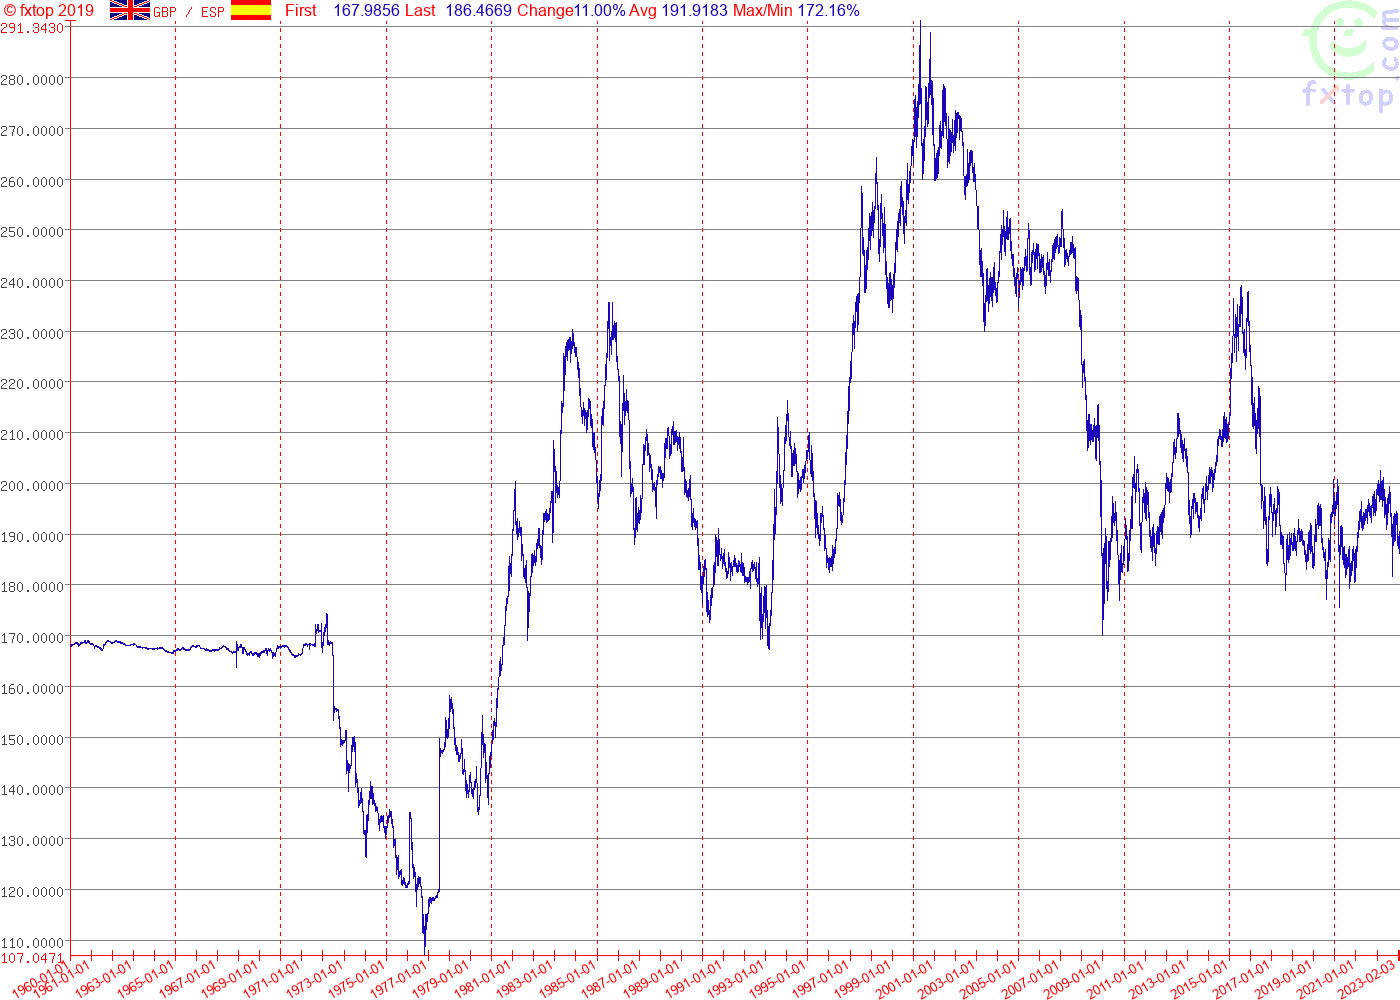
Graph of the exchange rate of the pound sterling (GBP) against the Spanish peseta (ESP) 1953-2023. Click to open larger image in a new browser tab. Image source: fxtop.com
Like the French franc, the Spanish peseta struggled from the eighties onwards until its absorption into the euro, since when, like all the other soft currencies that were sucked into the euro, the nation has paid an enormous price for this enforced fiscal respectability.
As a cheap holiday destination for the masses it has cushioned for UK tourists the decline in the GBP – even while the GBP slithers downwards, the peseta slithers downwards even faster, meaning that in the nineties one GBP would buy more and more pesetas. There was a building boom in Spanish resorts and a large number of Britons were able to buy property and even retire there, despite the rockiness of their own currency.
However, don't feel too superior. If we look at the value of one of these basket-case currencies, say the ESP, against the CHF, our reference for a strong, well managed currency, we get a graph that is not unlike that for the GBP-CHF:
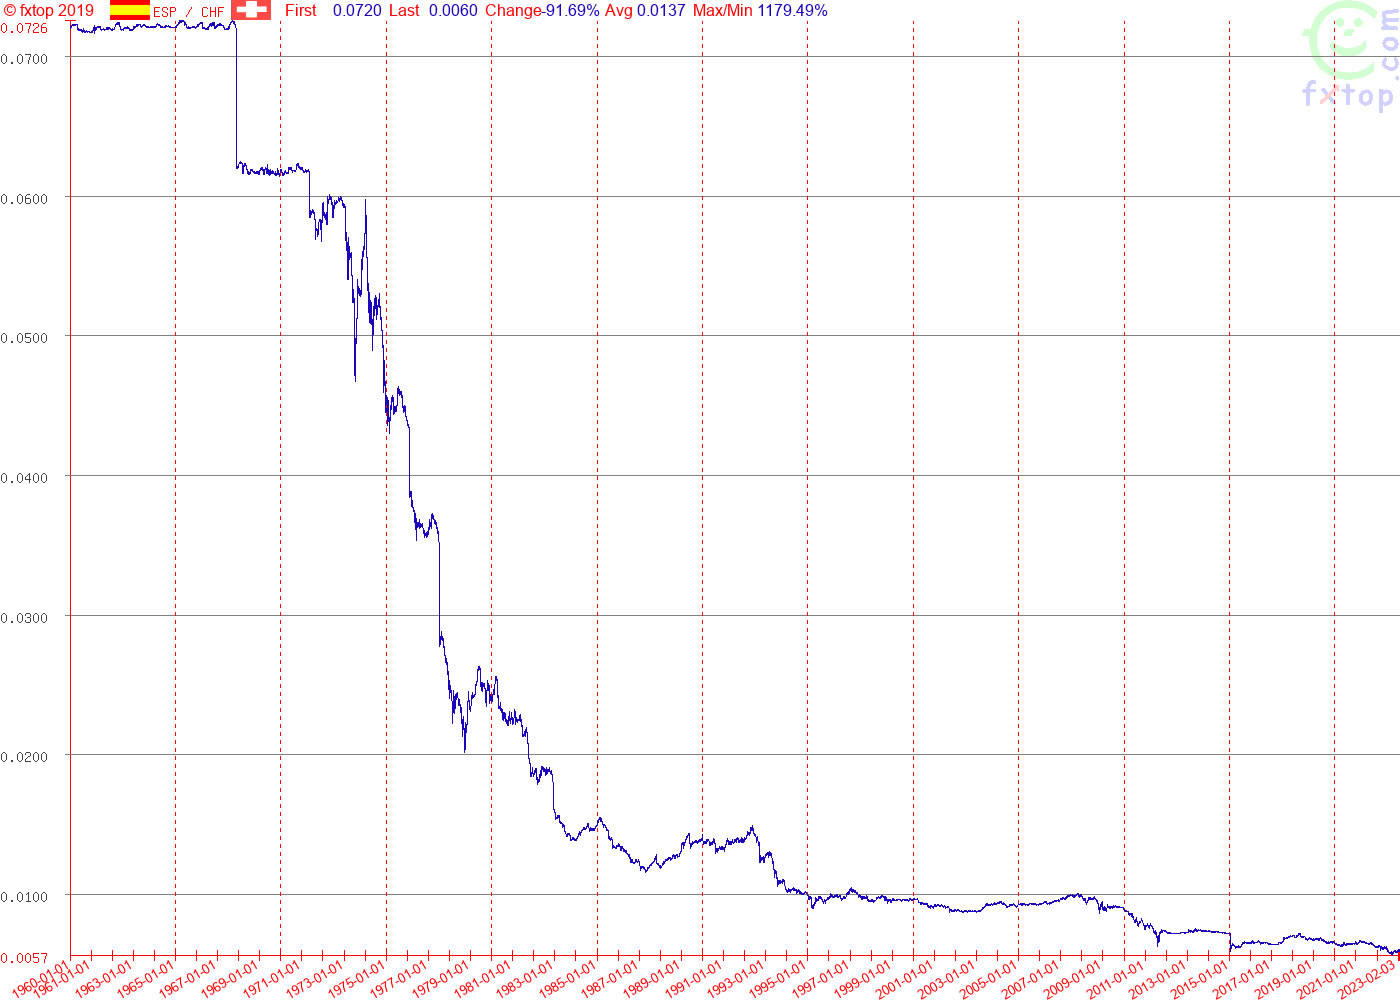
Graph of the exchange rate of the Spanish peseta (ESP) against the Swiss franc (CHF) 1953-2023. Click to open larger image in a new browser tab. Image source: fxtop.com
A total change of -91.69%, only slightly worse than the GBP-CHF change of -90.65%. And remember, the most recent third of that graph is actually against the euro.
Conclusion
A common economist's trick is to display the historical exchange rate of the GBP against a 'basket of currencies'. Well, that sounds reasonable, but the questions arise when you look what else is in the basket. In the Swiss franc we have a currency that has maintained its value, whether against baskets – however they are chosen – or individual currencies. A country should measure itself against the best, not the mediocre.
A nation's exchange rate reflects the quality of its currency as it is seen by outsiders. That quality may not be obvious to the citizens of the nation carrying out their internal transactions in the currency, but it is perceptible in the untruth made famous by Harold Wilson: 'the pound in your pocket'.
In a nutshell, the citizens of nations with weak currencies (UK, France, Italy, Spain) are poorer than those in nations with strong currencies (Switzerland, Germany).
As far as the UK goes, reflect on one simple fact: the incomes of more than half of the adult population of the country are too low to even qualify to be taxed. Apart from VAT, some marginal NI contributions and other odds and ends, they pay nothing towards the ever-increasing burden of the state (NHS and benefits system included).
We might be persuaded that the Conservative management of the economy is taking us to the sunlit uplands when they finally do something that improves the value of the currency. You can't rig the exchange rate, though: it depends on fiscal sanity and sound money. As such, the deplorable downward slide of the pound during the reign of Elizabeth II is the indicator that these two qualities were lacking during this period. After those seventy years, that glorious reign, we are left talking bitterly of 'broken Britain'.
For too long, politicians wanting quick economic fixes have allowed the exchange rate to slither down in the belief that ordinary voters without foreign real estate would not notice. Usually they don't. The foreign holiday trade kept going by seeking out destinations with weak currencies, ditto foreign property purchasers.
There isn't a lever in the Treasury marked 'Exchange Rate'. The exchange rate isn't a lever, it's a meter. Its reading reflects factors such as the balance of payments or trade deficits, public spending and borrowing, interest rates, inflation (e.g. that epic plunge in the GBP-CHF rate in the 1970s), general fiscal policy and economic growth – it is the cardiograph on the nation's heart. We need to keep a close eye on it and understand what it says about us if we want to survive.
0 Comments UTC Loaded:
Input rules for comments: No HTML, no images. Comments can be nested to a depth of eight. Surround a long quotation with curly braces: {blockquote}. Well-formed URLs will be rendered as links automatically. Do not click on links unless you are confident that they are safe. You have been warned!